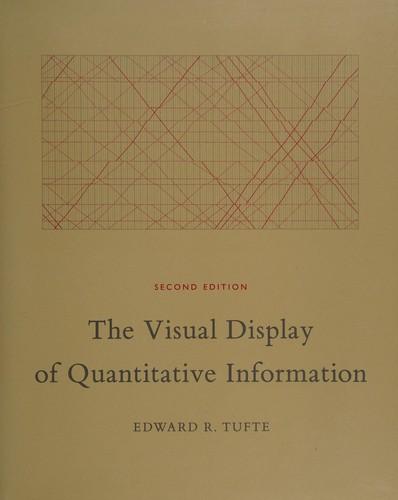
The Visual Display of Quantitative Information
by Edward R. Tufte
Taste attributes: documentaryslowfresh & originalheavyrealisticintricatelinearempowerment/personal growthsocial commentary
Boxlist takeFresh and realistic: a slow-burning non-fiction book, heavy rather than light. Best if you like real life over fantasy.
Taste details
Pace: slow · Originality: very fresh · Tone: balanced · Weight: heavy · Realism: true to life · Story: intricate · Structure: balanced · Look: balanced · Scale: balanced · Emotional punch: balancedHow we score
Open Library rating
4.2 / 5
31 ratings
About This Book
The classic book on statistical graphics, charts, tables. Theory and practice in the design of data graphics, 250 illustrations of the best (and a few of the worst) statistical graphics, with detailed analysis of how to display data for precise, effective, quick analysis. Design of the high-resolution displays, small multiples. Editing and improving graphics. The data-ink ratio.
Description: Open Library
Characteristics
Where this book sits on each taste spectrum
Genres and themes
Subjects
Details
- Author
- Edward R. Tufte
- Published
- 1983
- Pages
- 197
- Taste scores
- How we score
- Source
- Open Library
How book matches work
Books are scored on the same ten characteristics as films and matched with the same formula and your own match bands. Book scores are estimates, made from Open Library subjects and descriptions plus an AI reading.
More books
Browse popular fiction and narrative non-fiction, with a match for your taste.
Browse Books